Friday, July 30, 2021

Collective Bargaining and Employment Discrimination

Economists have long held the view that discrimination in hiring is best controlled by markets that are competitive.  The rationale is that competition in the product markets will make employers cost-conscious, and that competition in the labor market will focus employers on job applicants’ workplace productivity.    

Employers may harbor some biased views of job seekers based on race, sex, age or other external features.  However, such employers will be punished in the competitive product market if bias leads them to turn away productive workers.  The punishment will take the form of lost of sales and revenues to their competitors who don’t discriminate.  The resulting lower profits ultimately leads inability to compete and closure of the affected firms.  

This automatic disciplinary process is thwarted if regulatory interventions create excess labor supply conditions.  A minimum wage or a wage determined by collective bargaining are both attempts to administratively elevate the wage above its competitive level.  The result of the higher wages will be increased unemployment and greater latitude to discriminate.  The resulting excess labor supply allows employers to express their bias without economic cost.  Bias against a given sex or race of worker does not have to be strong to, nonetheless, create significant disparities in employment.  

This is particularly important to current policy.  The Biden administration has pledged to increase the number and power of unionized labor.  In addition to making American industrial products less competitive on world markets, this amplifies the power of public sector unions.  Teachers’ unions, for example, use the teachers’ union dues payments to underwrite campaigns for left-leaning politicians and teachers.  This, in turn, sustains the public school monopoly and the poor quality of K12 education that results.  Mr. Biden has pledged to eliminate charter schools (which generally are non-union) because they outperform the more costly unionized public schools.

As noted earlier, a side effect of unionized wage-setting is that it makes discrimination in hiring more likely.  Indeed, as Nobel-Laureate economist Gunnar Myrdal observed in his 1944 book, An American Dilemma, “…the fact that the American Federation of Labor as such is officially against racial discrimination does not mean much. The Federation has never done anything to check racial discrimination exercised by its member organizations.”  The same could be said about teachers’ union opposition today to public funding of private schools for black students.

In 2019, Lincoln Quillian et al. published a detailed study of job discrimination across 8 countries using actual data on the outcome of job applications by white versus non-white applicants.  This affords an opportunity to illustrate the impact of unionization on discrimination because the influence of unions on wages varies significantly across countries.  The study used data from 200,000 job applications to determine whether the minority applicants experienced a lower rate of callback than their otherwise-similar white jobseekers.  In low discrimination countries the minority applicants experienced callback rates were about 25 percent lower than white applicants.  In the high discrimination countries, the minority applicants were treated 4 times more negatively than white applicants.  

For each country, a discrimination score was developed as a ratio of the number of applications that must be submitted by a minority applicant to expect an equal chance of a callback as a white applicant.  Figure 1 illustrates a general tendency for counties with high levels of collective bargaining to have high levels of discrimination.  In contrast, as the regression line in Figure 1 illustrates, countries with lower levels of collective bargaining tended to lower levels of discrimination as well.  

The simple correlation across all countries in the sample is approximately +50%, which implies a moderate positive relationship between unionization and discrimination.  An oft-used alternative measure of the degree of discrimination is the unemployment rate of the minority applicant to that of a white applicant.  That correlation from that approach is less persuasive.  The observed correlation is typically +20%, which is much weaker than the correlation displayed here. 

Figure 1: Correlation between Collective Bargaining and Discrimination

The authors had expected that the mainly socialist-leaning European countries would perform better than countries like the US, with less elaborate labor regulations.  In fact, as argued earlier, such intrusions create exactly the conditions in which job discrimination is expected to thrive.  Indeed, Sweden and France, display the highest rates of discrimination, and also had the highest shares of wages determined by collective bargaining. 

Norway, the Netherlands, and Belgium received low discrimination scores, despite the large share of wages that are subject to collective bargaining.  However, the small labor markets limited the number of applications that the researchers could study.  The US cohort f applicants had data from 73,000 applications whereas the number of applications available for study were only 3,500 to 6,000 for these three smaller countries.  In fact, the researchers considered the scores statistically insignificant.  They are plotted in Figure 1 for completeness sake and also because, within the group, higher rates of collective bargaining seem to be associated with relatively higher discrimination rate scores.  This observation, however, does not survive testing for statistical robustness, however.

The German markets, with only about 50 percent of wages subject to collective bargaining fit the hypotheses some what better and, infant  their discrimination score is not testable different from the US score.  The low (12 percent) collective bargaining percentage of the US is consistent with our competitive and relatively unregulated labor and product markets.  It is ironic that politicians who otherwise would describe themselves as progressive would embrace policies that will likely encourage greater unemployment and discrimination of minority workers.  

Sources:

Quillian, Lincoln, Anthony Heath, Devah Pager, Arn- finn H. Midtbøen, Fenella Fleischmann, and Ole Hexel. 2019. “Do Some Countries Discriminate More than Others? Evidence from 97 Field Experiments of Racial Discrimination in Hiring.” Sociological Science 6: 467-496   

Thursday, July 8, 2021

Standard of Living: US vs. Social Democracies

The US economic and political system is under attack by left-wing politicians and academics  who find fault both with our free-market economy and the Constitution that guides our public policies and legal systems.  Now in place, the Biden administration appears be adopting policies that are antithetical to these key aspects of our society.  The left, it seems, believes we would be better off if we relied instead on socialist approaches whereby government exerts direct and granular control over more aspects of our lives.  

Some of the discussion focuses on publicly provided services, such as education and public health care.  As an economist, I agree that both sectors are underperforming in the US, but would argue that the problems arise from too much public sector control—not too little.  It is certainly not because we spend too little in these areas.  In 2018, for example, the U.S. spent 16.9 percent of gross domestic product (GDP) on health care, nearly twice as much as the average OECD country.  Similarly, In 2017, we spent $12,800 per student on public education.  This is the second-highest of any country in the world.  

Switching to a model with even more government involvement and spending is thus hard to justify.  Rather, the inept government intervention in both markets should be addressed by greater privatization and competition.  For example, our public school system is a monopoly run for and by its unionized management and labor.  It should be replaced by one where parents and their students are in practical and financial control, and have choices about where and what the students learn.  During the Covid-19 pandemic, parents got front row, video access to the biased and corrupt state of education in US K12 classrooms.  

Similarly, our health system would benefit from removal of the government policies that constrain the supply of health care workers, raise the cost of drug development, make the cost of care opaque, and couple insurance access to employment.  Again, all of these changes would bring more, not less, competition and pricing discipline to health care. The vaunted, government run health care monopolies are not the solution.  Direct regulation of doctor salaries, for example, may bring down cost superficially, but notoriously impose costs in the form of queues for service and rationing of access.  

In most other parts of the economy, such competitive supply and pricing prevails. In so doing, market reigns, the free market elevates our high standard of living.  We can easily demonstrate that our greater use of private markets affords the average American a much higher standard of living than other developed countries.  Measuring the “standard of living” can be done at various levels of granularity, such as measuring the number of rooms in one’s house, the number of automobiles owned, televisions owned, food eaten, etc.  But the simpler and more agnostic approach is to measure the annual dollars that are able to be spent by households on consumption.  Doing so on a per capita basis helps adjust the measure for differences in family size.  

There are some challenges in measuring the standard of living this way across multiple countries.  For example, countries use different currencies whose variable values have to be considered.  In addition, the supply conditions of specific goods and services vary greatly across countries.  A commodity that is very costly to purchase in one country may be cheap to obtain in another.  The goal is to normalize these variable factors and achieve so-called Purchasing Power Parity (PPP).  The basic idea of PPP is to use the prices of specific goods to compare the absolute purchasing power of the individual countries' currencies  

The purpose of this blog is to do just such measurements for the various countries so the comparisons can be made with that of other developed economies.  The Biden administration’s policies seem to be modeled on increasing socialization of the economy.  Thus, I have drawn the sample from OECD member economies, some of which are modeled on this philosophy.  We can then see whether consumers perform better or worse under a socialized regime versus a private market regime such as ours.  

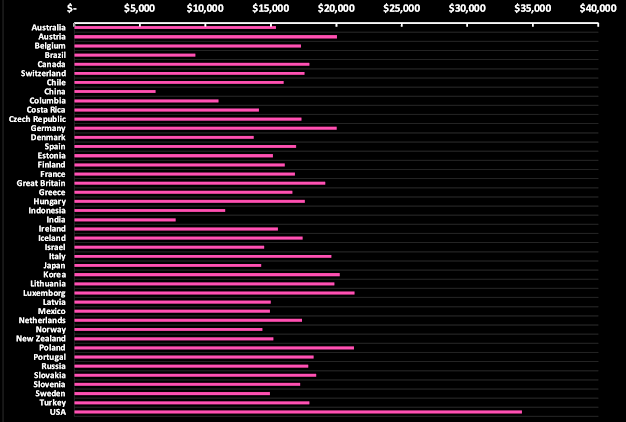
The resulting measures of consumer spending use the International Dollar as the unit of value after adjustment of their original currency.  Since the International Dollar measure is available benchmarked to 2011, I obtain the nominal measures (of consumer spending, exchange rates and PPP) in that year for each country.  The US dollar is the currency to which exchange rates and PPP adjustments are benchmarked and thus the US CE  needs no adjustment.   The adjusted results for others are presented graphically in Figure 1.  

Figure  1.  Annual Consumer Spending, Per Capita, in 2011 International Dollars


Note that the USA consumption spending value, at over $34,000 per capita, dominates the value of the other listed countries.  This is because our market-oriented economic system, has low household taxation, in addition to efficient and competitive markets.  This leaves the household with greater personal consumption opportunities.  

Since the Biden administration seems preoccupied with the welfare of black Americans, I use the example of black Americans to illustrate this effect.  A measure of consumer expenditures per capita for black Americans is available from the Bureau of Labor Statistics (BLS). It is developed from Consumer Expenditure (CE) Surveys by combining surveys from the years 2010, 2011 and 2012.  I can compare it with the survey data for other countries which are in 2011 International Dollars.  

Based on CE data, combined from 2010 to 2012, black households’ annual expenditures averaged $36,149, which was 79.8 percent of their average income before taxes.  The average household size is 2.6 persons, with the result that US African Americans in 2011 enjoyed consumer expenditures per capita of approximately $14,000.  

Thus, the average black American consumer enjoys, by this measure, a standard of living that is in the range of 13 of the 42 nations studied, including Denmark, Norway, and Sweden, all of whom are social democrats politically.  This demonstrates that social democracy and its associated high tax rates limit private opportunities for a higher standard of living.  (Low income Swedes, for example, face a total tax rate of over 60 percent).  This finding also demonstrates that American households of all races would be better off supporting the adoption of private market reforms of markets such as K12 education and healthcare that suffer today from public sector mismanagement.

Sources: 

Reginald A. Noël, “Income and spending patterns among Black households,” Beyond the Numbers: Prices and Spending, vol. 3, no. 24 (U.S. Bureau of Labor Statistics, November 2014), https://www.bls.gov/opub/btn/volume-3/income-and-spending-patterns-among- black-households.htm 

OECD (2021), Household spending (indicator)

OECD (2021), Household disposable income (indicator). 


Monday, July 5, 2021

Police Shootings: Statistics, Opinions, and Game Theory


After the death of Mr. George Floyd at the hands of Minneapolis police officers, the press emphasis on the race of the victim was immediate.  The death was, to many, confirmation that that there was a consistent pattern of biased treatment of black individuals in encounters with law enforcement.  The Floyd incident did not involve a shooting; Mr. Floyd died while being restrained through a knee-hold by the involved officer.  Nonetheless, press accounts tended to conflate the event with the police shootings issue.  


The event sparked protests and riots in 550 cities and damages (according to insurers) of $1 billion or more.  Although the cruelty of the Floyd event may have been enough to spark such a response, it seems likely that the representation of police shootings as evidence of persistent and structural racial bias played a key part.  The press accounts of the statistics of policy shootings was draw from numerous sources, but relied significantly on the use of the Washington Post (WP) newspaper’s shootings database.  For example, the infographic in Figure 1 was produced and widely disseminated by the Statista service.  It used data from the Washington Post shootings database from 2015 through May 28, 2020.  

Figure 1.  Infographic on U.S. Police Shooting rates, by Race, June 2020


As the graphic indicates, the total number of police shooting deaths, by race, in the 2015 to 2020 time span of the database, averaged approximately 1,000 per year.  Notably, there were almost twice as many White as Black shooting victims.  However, Statista normalized the rates across race by dividing the absolute number of deaths by the estimated population of each.  The graphic then reports the rate on a per million population basis.  (Note:  Statista allows reproduction of its infographics as long as proper attribution is made to the company.)

As a result, the rate for Black victims is nearly three times that of White persons and almost 50 percent larger than for Hispanic persons.  Although use of a per capita or population averaging scheme is common, it is usually employed when population is the factor most likely to generate variation that needs to be accounted for.  For example, when studying the importance of the restaurant industry by city, it makes sense to adjust for the size of the individual cities’ by population.  This is because population is likely a main determinant of demand for restaurant services.  


This is not so in the context of police shootings.  Police actions occur in the setting of violent activity and affect very specific populations.  That is why the per capita involvement in violent victimization settings is very different by race, as revealed by the violent victimization survey of the Bureau of Justice statistics (BJS).  


According to the 2010 to 2015 BJS survey, the per capita violent crime rate—the number of violent crimes committed by persons of a given race divided by its population—is very different by race.  That of Blacks is 950 percent that of Whites.  That of Hispanics is about 140 percent of that of Whites.  This is contrary to the measure presented in Figure 1 which implicitly assumes that police contact with the citizenry is random across the entire population.  When this is incorporated in an infographic such as Figure 1, a very different picture inevitable emerges.  Specifically, it appears that almost exactly one person is killed for every thousand persons of a given race, irrespective of whether their race is Black, White or Hispanic.  


Figure 2.  U.S. Police Shooting rates, by Crime Rate by Race, June 2020


This result is contrary to the widely accepted notion represented in Figure 1 which implies a significant tendency toward police shooting of black individuals.  It is likely that the Statista analysis, which likely was widely used in press reporting and internet communications, amplified the stereotype of police bias against minorities.  The simple per capita approach is commonly used by others, such as PoliceScoreCard.org (2021).  


The Statista analysis, by using a simple, population adjustment to the raw statistics, is of no practical use in evaluating the underlying issue of racial disparity in police shootings.  The implication of Figure 2 is that the crime rate—by itself— is an important determinant of police behavior.  The finding of a nearly identical shooting rate by race across the three races says that evidence of racial bias in police shootings has to be sought elsewhere. 


To that point, there are other studies that report finding bias using other data or using other methods, such as Ross (2015).  Other studies focus on other dimensions of the interactions of civilians with the police, such as vehicle stops and searches, use of handcuffs, use of non-lethal methods, and specific circumstances such as whether the civilian was armed or not.  There are also studies that use shootings data that report finding little or no bias, such as Johnson et al. (2019), and when police decisions to shoot are studied via simulations, such as Correll et al. (2007).  


The ambiguous state of the literature is because of the ambiguous nature of the phenomena being studied.  An encounter of a civilian and a police officer is a classic instance of what economists call a “game theory” problem.  Specifically, an active encounter of a putative criminal with police puts the two parties in a setting that triggers brinkmanship behavior.  The putative criminal has a goal of besting the police in order to gain a positive outcome (getting away with a monetary reward or freedom from some punishment), while the police hopes to best the criminal and thereby be rewarded by preserving personal or citizen safety, life or property.


The escalation of effort is the path to one party prevailing.  However, this escalation is what makes extreme outcomes like killing your opponent likely.  This is because neither party understands fully (a) what the other party has at stake or (b) how extreme the other party will act.  As the economists Dixit and Nalebuff point out in their research on strategic behavior, this uncertainty or risk raises the likelihood of catastrophic events even when the mutual intent of the parties is to act rationally.  Put differently, the two parties have to use what information they have or can detect in the behavior of the other to disambiguate what is likely to happen.


It is naïve to think that the parties lack some statistical opinion of the likely behavior or capabilities of the other.  The dramatically higher violent crime rate of Blacks is part of the statistical baggage that police bring to the encounter, leading to an expectation of a more difficult interaction.  Similarly, if the surveys by the Gallup Center on Black Voices are accurate, Blacks have a 50 percent higher probability than Whites of having experienced police in their neighborhood, and fewer than 1 in 5 expects to be treated respectfully (versus 56 percent of Whites).  Thus, both parties are arguably in an already-escalated, defensive state when the encounter occurs.  


The implications for policy are not trivial.  Both groups have to exhibit different behaviors so that more conciliatory interactions are expected of each other.  The work of Corman et al. (2002) and Miller et al. (2004) using the experience of New York City in the 1990s is that increased police presence can provide both better service to the community and improve mutual familiarity of citizens and police.  


The one policy that seemingly will absolutely nothelp in this regard is unfunding and reducing police presence.  The surveys done by Gallup's Center on Black Voices reveal that, though there are important trust issues to resolve, most Blacks value a police presence.  Indeed, the Gallup survey report by Saad (2020) reveals that fully 81 percent of Blacks desire the same or greater police presence.  Unfortunately, the current unfunding programs seem to aggravate neighborhood crime levels and discourage retention of all police staff, including those for whom better community relationship development would be welcome.    


Sources:


Ross CT (2015) A Multi-Level Bayesian Analysis of Racial Bias in Police Shootings at the County-Level in the United States, 2011–2014. PLoS ONE 10(11): e0141854. doi:10.1371/journal. pone.0141854 


D. J. Johnson, T. Tress, N. Burkel, C. Taylor, J. Cesario, Officer characteristics and racial disparities in fatal officer-involved shootings. Proc. Natl. Acad. Sci. U.S.A. 116, 15877–15882 (2019)


https://policescorecard.org, July 2021.   “Key Findings, 8,768 killings by police, Based on population, a Black person was 2.9x as likely and a Latinx person was 1.4x as likely to be killed by police as a White person in America from 2013-20.  


Joshua Correll, Bernadette Park, Charles M Judd, Bernd Wittenbrink, Melody S Sadler, and Tracie Keesee, “Across the thin blue line: police officers and racial bias in the decision to shoot 

“ J Pers Soc Psychol. June 2007.


Avinash K. Dixit and Barry J. Nalebuff: Thinking Strategically, W.W Norton, pp. 205–222 (1991).


Saad, Lydia, “Black Americans Want Police to Retain Local Presence,” Gallup Center on Black Voices, August 5, 2020


Corman, Hope and Naci Mocan, “Carrots, Sticks and Broken Windows,” NBER Working Paper No. 9061 July 2002 


Miller, Joel, Robert C. Davis, Nicole J. Henderson, John Markovic, Christopher W. Ortiz, “Public Opinions of the Police: The Influence of Friends, Family, and News Media,” an independent report to the US Institute of Justice, May 2004 2001-IJ-CX-0038 


Thursday, July 1, 2021

Update on Light Bulb Bans

For more than a decade we have all been lectured on the virtues of changing lighting technology.  The standard, tungsten (incandescent) lighting has been challenged by compact fluorescent lights (CFLs) and bulbs based on light emitting diodes (LEDs). Here is a typical, effusive projection:

CFLs are four times more efficient than standard, incandescent bulbs and last nine to thirteen times as long. If everyone bought just one CFL and replaced their old standard bulb, America would save $8 billion in energy costs, prevent the burning of 30 million pounds of coal, and save greenhouse gas emissions equal to two million cars. Convert all the bulbs and the savings would be in the tens of billions of dollars.

The US government Energy Star program makes similar claims:  

ENERGY STAR estimates that if efficient lighting were used throughout the country, the nation's annual demand for electricity would be cut by more than 10%. This would save ratepayers nearly $17 billion in utility bills.

Sounds good, but should there be a comprehensive ban on incandescent lighting?  The short answer is, "not necessarily". In fact, they make little sense in a cool climate, either from an energy conservation, environmental or consumer cost standpoint.  Ironically, the movement to ban incandescent bulbs is, in fact, in limbo as this is being written. The restrictions were to go into effect for all US states on January 1, 2020.  

But in October 2019, the US Department on Energy (USDOE) decided that the regulatory target--a so-called General Service Lamp (GSL)-- was not clearly-enough defined and, in effect, stopped the federal ban on incandescent bulbs.  State and local regulation of the GSLs is in limbo, with some states already restricting incandescents and others still planing to do so.  Some of these parties sued the USDOE, and the case is currently in the Second Circuit Court. This makes this update timely.  

The Forgotten Physics

A 60 watt incandescent bulb does, indeed, use about four times the energy to produce roughly equivalent illumination, in lumens, of a compact fluorescent (CFL) or an LED bulb. As the table below indicates, the lumens per watt of household size bulbs shows that a CFL provides about 40 more lumens and an LED 50 more lumens per watt.  Put differently, approximately 75 percent of the power consumed by the incandescent bulb does not produce light, relative to the two other bulb technologies.

In addition, relying on incandescent bulbs over time requires more bulb replacement.  A normal incandescent bulb is currently about a fifteenth the life of an LED, given the total lumen-hours of the respective technologies.  This means that one can save three quarters of one’s lighting energy budget by switching to LED lighting.  

However, contrary to the simplistic logic that energy that does not provide lighting is “wasted”, physics tells us that energy is conserved and does not simply disappear.  In particular, virtually all of the “extra energy” that is used by an incandescent bulb is dissipated as infrared radiation or convection heat. 

In other words, the incandescent light bulb is heating--as well as lighting-- the room.  Thus, if the lighting is in a space that must be heated, whether or not this energy lost is a "waste" or not depends upon the climate and heating conditions. If the house is heated, by a gas or electric furnace, the excess heat produced by the light bulb reduces the net demand on these heating systems. This is called the Heat Replacement Effect.  

Since three quarters of the energy of an incandescent bulb is available to replace the central heating energy, the economics of this effect can be large, even considering the higher number of incandescent bulbs required over the LEDs.  Over the 25,000 hour life of an alternate, cold LED lighting system, for example, the heat energy produced by the incandescent bulb (45 watts per hour) has a value of about $170 at 15 cents per kilowatt hour (assuming that to be the cost of space heating energy.  This is more than enough to eliminate the higher total cost of the incandescent.  

Thus, in cold and mild climates, at least, there may be no effect on either the cost of electricity to the consumer, or the amount of greenhouse gasses emitted in the production of the electricity used.  Indeed, since high latitude climates also are darker and require lighting, the incandescent bulb may be an effective way to deliver warmth closer to the user of the lighting system.  

On balance, in cool climates where buildings are heated during low-light seasons of the year, it is not at all obvious that a blanket policy of banning incandescent bulbs makes either economic or environmental sense. They may make sense in regions where additional air conditioning load would be required to offset the incandescent bulbs' heat, but those of us in the coastal northwest should think twice.  

Sources:

Shahzad, K. et al., (2015). Comparative Life Cycle Analysis of Different Lighting Devices, Chemical Engineeering Transactions, VOL. 45l

The Heat Replacement Effect, UK Market Transformation Programme, BNX05, Updated: 19/09/2007, www.mtprog.com 

Scott Anderson,  A state by state look at light bulb bans as of 6/30/21.  https://insights.regencylighting.com/state-light-bulb-bans